Paper of Record Unveils Patented Graph Proving Electorate Is Just Six Anxious Guys
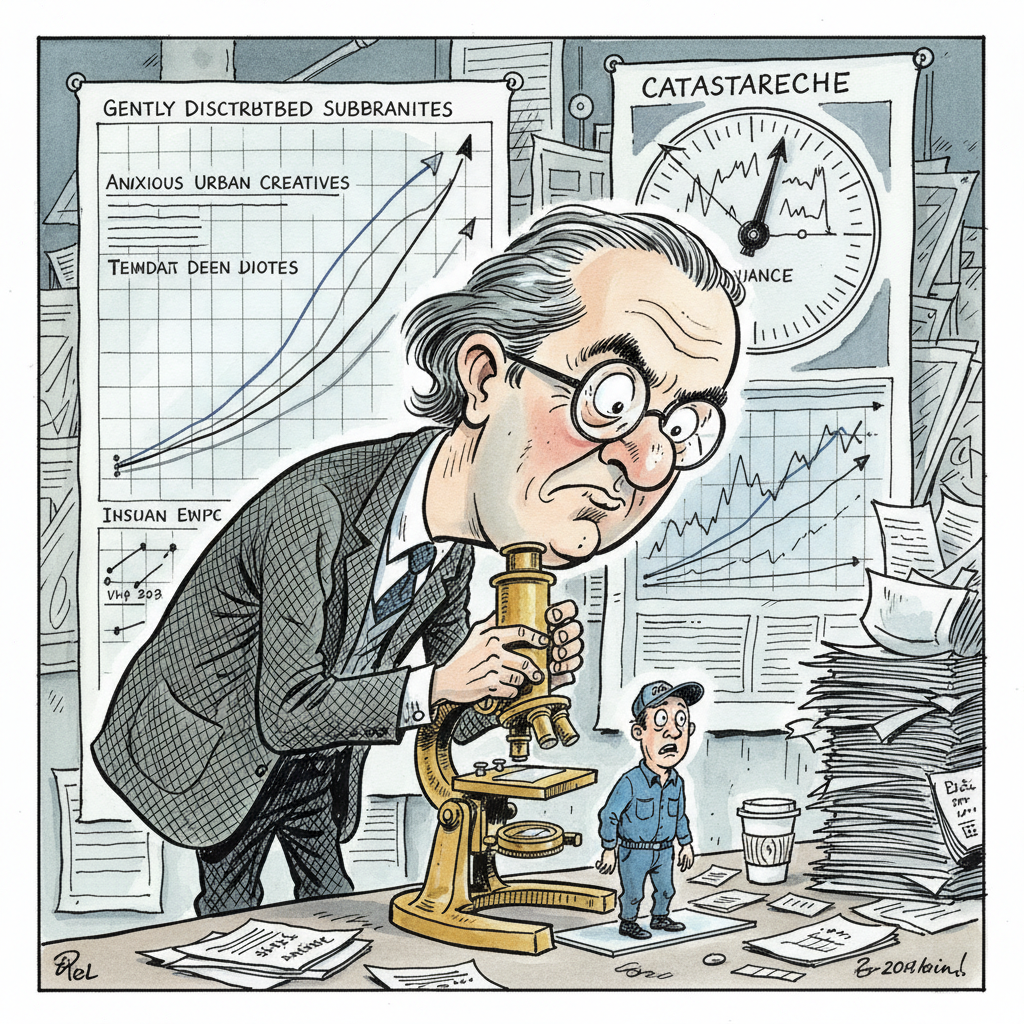
Following three consecutive election cycles spent fundamentally misinterpreting Ohio, legacy media strategists have finally cracked the civic code by replacing human judgment with a shimmering new demographic carousel. Dubbed Voter Trends, the proprietary data tapestry segments the American body politic into 14,000 bespoke sub-castes, allowing digital subscribers to track the precise voting intentions of divorced kayak enthusiasts in suburban Kenosha who harbor lingering resentments toward fiber-optic cable. "Readers demanded an interface that treated national collapse like a boutique quarterly retail dashboard, and we delivered," explained Deputy Graphics Architect Julian Mercer, adjusting a multi-axis scatterplot tracking the micro-shifts of undecided dental hygienists. Mercer confirmed the breakthrough platform integrates seamlessly with the publication's signature anxiety needle, ensuring that whether candidates debate industrial trade policy or territorial integrity, the solemn democratic exercise will invariably be rendered as a trembling interactive donut chart predicting impending civic doom with 98 percent typographic elegance.